Nieman Journalism Lab |
- Measuring networks: The limitations of how we try to understand online activity
- Pew: YouTube is bigger than Twitter for news
- Pocket shows the power of data in picking stories
- The newsonomics of the surprisingly persistent appeal of newsprint
| Measuring networks: The limitations of how we try to understand online activity Posted: 14 Nov 2013 12:30 PM PST A new report from two fellows at the Berkman Center for Internet and Society is out today: “Measuring Internet Activity: A (Selective) Review of Methods and Metrics” breaks down attempts at measuring the impact of the Internet into three categories — infrastructure and access, control, and online content and communities. The main takeaway: Our methods for measuring online activity are fragmented and usually offer only an incomplete, if tantalizing, picture of how people learn and communicate online. Still, there are some intriguing arguments and examples in the report worth mentioning, especially regarding the content and communities layer of the web. Write authors Rebekah Heacock and Rob Faris:
The method of observation with which we’re most familiar is the survey, which is inherently problematic — expensive, often biased, non-representative, subjective, and inconsistent, according to the report. But surveys are also a frequently conducted and readily accessible technique. Some examples cited in the report include the work of Pew Research Center’s Internet and American Life Project, Eurostat, Web Index, and the World Economic Forum. But beyond surveys, Faris and Heacock break down the measurement of online behavior into more quantifiable and more granular categories, such as search data, analytics, and social networking data (“e.g., hashtags, followers, or likes”). On the potential of search:
On the limitations of third-party analytics:
On the potential of data from social platforms:
And on their imperfections:
Ultimately, the authors find they are more interested in measuring the impact of networks rather than the behaviors of individuals:
The report goes on to cite gaps in knowledge and funding and suggest arenas for further study, concluding that while there is a plethora of information available, “the power of big data and web analytics is yet to catch up with the data needs of policy making.” Image by William Warby used under a Creative Commons license. |
| Pew: YouTube is bigger than Twitter for news Posted: 14 Nov 2013 11:30 AM PST Pew Research has a study out today on news and social media. Most of the findings aren’t particularly surprising — people who use Facebook also use other platforms; younger people are more likely to use Twitter, while middle-aged people are more likely to use Facebook; Democrats are more active social news consumers than Republicans across platforms. Anther expected outcome: Twitter and Reddit are the platforms where the largest shares of their users use them to get news. But what’s interesting is that those numbers don’t translate to reach (emphasis added):
The study also looks at mobile behaviors, traditional versus social news consumption, and how many different platforms people are using to consume news. |
| Pocket shows the power of data in picking stories Posted: 14 Nov 2013 10:39 AM PST
The New York Times is a leader among news organizations when it comes to article recommendations — but the entire news business is miles behind e-commerce here. (There’s no news-company equivalent to Amazon’s ability to push you from one book to another or Pandora’s ability to figure out your taste over time — even though we leave a trail of readership data on every news site we spend time on.) Pocket, the read-it-later app formerly known as Read It Later, put out a new version yesterday with a big feature called Highlights:
(Pocket rival Instapaper has something broadly similar called InstaRank that debuted in September.) Imagine if a news organization were to use all of the signals available to reshape the story mix it presents. “We know that you like Wonkblog and everything Dana Priest writes. We know you hate Redskins stories but love the Nationals. We know that you live in Georgetown but work in Arlington. We know it’s Saturday afternoon, when you tend to read longer stories. We know that for people with your preferences, this Style column’s been doing surprisingly well lately. We know that you started that investigative series but never got past the eighth paragraph. We know you’ve been following every minute detail of this court case. Based on all that, here’s the set of stories we’re going to offer up today.” |
| The newsonomics of the surprisingly persistent appeal of newsprint Posted: 14 Nov 2013 09:11 AM PST Tonnage. The word speaks to a different age of news media when ink, bought by barrel, and newsprint, bought by the ton, ruled. Newspapers — in print — still go out to some 40 million-plus Americans and as many as 1.4 billion worldwide. We usually focus on the news part of the newspaper business, of course, but it’s worth taking a few minutes to track the once-in-a-lifetime transformation to which we are all incredulous witnesses. Let’s not yet bury newsprint. It’s been a good friend for centuries — and still enables more than 75 percent of revenue for almost all newspaper companies on the planet. Let’s talk about paper: what’s happened to it and where it may fit in the hybrid print/digital business models of news companies going forward. Here is why it’s newly important: It’s print subscribers — now being priced up and upsold into all-access digital plans — who are responsible for the only bright spot in newspaper revenue growth. Though 85-95 percent of these subscribers are staying through these rounds of price increases, only a minority of them actually use the newspapers’ digital products much. They like newsprint. We’ll get back to that paradox in a bit, but first some stark numbers portraying the flip side of the digital march:
The decline has been most profound in North America, which is using barely a third of the newsprint it used in 2000. Western Europe is now cutting back significantly, down 27 percent for the same period. Japan is moving downward. Forget what you hear about this being a developed/developing world dichotomy: Newsprint use is going down globally. While it rose greatly in Asia over the past decade, it’s since moved into decline. Even in India, newsprint usage has flattened and is moving downward; 2010 seems to have been the turning point year there. It’s trending downward, though more mildly at this point, in Latin America. The havoc we’ve seen in the U.S. — and now the European — newspaper industry is mirrored in the newsprint business. It’s seen massive job loss, bankruptcy, and consolidation — its market cut in half and its prices forced downward. So the industry has diversified beyond North America, into other paper sectors — and into market intelligence products (that’s right, Big Data, crunched to Little), says Martine Hamel, vice president of the Pulp and Paper Products Council, based in Montréal with offices in Brussels and Beijing. The newsprint usage decline almost matches the print advertising decline. That 62 percent decline in 13 years matches up with a 60 percent decline in U.S. print advertising over a shorter period. Last year’s 10 percent drop matches the 9 percent decline in print ads. Significantly, the cut in newsprint usage in North America has been greater than the loss of circulation volume. The loss in print readers has been less than the newsprint cutbacks by news publishers, by about 10 percentage points. Why? First, there’s that ad loss; fewer ads, less newsprint needed. Second, publishers continued to cut to eke out their mild profit, as they have since the Great Recession. In Europe, the play between print reader loss and newsprint cuts is more checkered. But now, entering 2014, what might the revolution of reader revenue do to newsprint usage? That could turn out to be a fascinating shorter-term question. Let’s revisit the paradox. Newspapers, especially in the U.S., have settled on all-access as their reader business model. Package it all together — print, web, smartphone, tablet, e-edition — and charge a new price, usually 10-25 percent higher than last year’s print price. Force consumers to opt out, and no more (usually less) than 15 percent of them will. All-access gives newspapers new data, and that data shows a surprising picture: Even though they are paying for all-access, many long-time print subscribers don’t use their paper’s digital products much or at all. In fact, only a minority (20-40 percent) show significant digital news usage. That’s an intriguing phenomenon. Newspaper subscribers are affluent and strongly represented among baby boomers. Thirty-one percent of Americans aged 50-64 own tablets, according to recent Pew research. Among Gen Xers (30-49), 44 percent own them. It’s just that many them still prefer the print paper, even though they use tablets, smartphones, and the web to read lots of other stuff. So they have a preference for print, and they’re becoming the primary contributors to newspaper revenue, as ads plummet in high single digits each year without end. The resulting question: Will publishers be somewhat more careful in further cutting newsprint usage? Given that subscribers are now paying $300 to $500 a year — when two years ago they were paying $200 to $400 — might newspapers have to tread it more carefully in cutting back on the print product? After cutting eliminated stock tables, TV listings, sports results, and lots of pages in general, might they slow down the cuts? After all, having millions of people willing to pay that large annual sum is a good problem to have. If some publishers are skimping on the paper-based product, we also have the ultra-contrarian play of Aaron Kushner’s Orange County Register. In his multiple print plays, the Register is using a whopping 18 percent more newsprint this year than last. While Kushner has been in the press with issues of litigation, the big question is around that 18 percent and what it represents about his wider strategy. Will it work? It may take several years — assuming the new Freedom can stay its financial course, especially if it closes its acquisition of the Riverside Press-Enterprise tomorrow. I checked in with Mike Klingensmith, publisher of the Star Tribune, which has managed the digital transition better than many of its peers (“The newsonomics of Pulitzers, paywalls and investing in the newsroom”) to get his sense of using newsprint in this digital age. Under new editor Rene Sanchez, appointed last month, the paper will put some “Sunday print upgrades” into effect in early 2014, following the addition of a new Friday Outdoor Living section in the fall, he says. With the number of print ads dropping, news pages now make up 74 percent of the Star Tribune’s pages, up from 72 percent a year ago. Running newsprint through a press, of course, is far less flexible than digital printing. On many weekdays, says Klingensmith, the paper is at “minimum book size”; it won’t, for example, drop below an eight-page business section on a given day. Consequently, as ad volume has dropped, editors add news content to replace it. Summing up the reader impact: “We believe very firmly that the heft of the delivered package is important, and we pay attention to that.” I haven’t polled publishers to see how many follow that line of thinking, but it should be a quite current concern. Publishers are now deciding where to cut in 2014. In the meantime, we do see a number of print strategies emerging. Largely, they track the newspaper industry’s progression from mass to niche, as Google and Facebook have become that new mass, first in time spent and increasingly in digital advertising. Consider, briefly, six areas:
Key to any incremental print growth will be dawn of integrated marketing. Digital is often the headliner, but print — often as niche, sometimes as mass — retails a power as part of a larger marketing package. To that end, there’s a lot of work going on in digital printing and other newer technologies to bring efficiencies to the old processes. A recent three-day “Power of Print” conference in Berlin, sponsored by WAN-IFRA, provided lots of seminars and how-tos. Indeed, the booths of Big Iron newspaper industry vendors seemed like a throwback to another age. Photo of printing press by Newspaper Club used under a Creative Commons license. |
 One of my hobby horses (I’ve got a few) is that news organizations aren’t doing enough to personalize the stories they present to users. The largest news companies produce a ton of content every day; individual users enjoy wildly differing subsets of that content. But, with few exceptions, they present the same homepage to everyone.
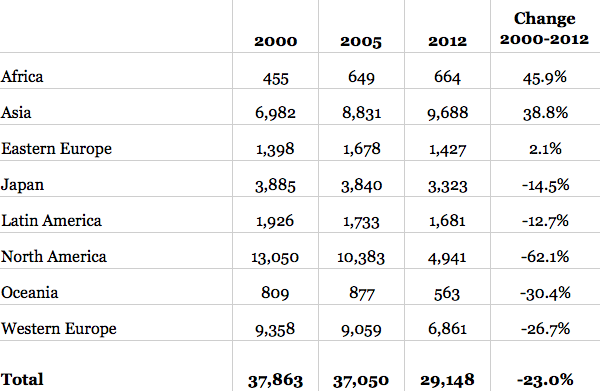
| You are subscribed to email updates from Nieman Journalism Lab To stop receiving these emails, you may unsubscribe now. | Email delivery powered by Google |
| Google Inc., 20 West Kinzie, Chicago IL USA 60610 | |