Nieman Journalism Lab |
- Why so serious? Maybe because data shows news stories can get shared just as often as lighter fare
- Data from the U.K.: The gender imbalance in newspapers is real, and both vertical and horizontal
- Matt Waite: How I faced my fears and learned to be good at math
- Who’s giving (and getting) that nonprofit money? Some data on grantmaking to media orgs
| Why so serious? Maybe because data shows news stories can get shared just as often as lighter fare Posted: 13 Nov 2013 09:06 AM PST Editor’s note: Our friends at NPR Digital Services, Eric Athas and Teresa Gorman, crunched the numbers on how public radio stories were shared on Facebook and found some encouraging results. We’ve heard this a lot lately: Fun stories, not serious stories, work on social media. But we’ve found otherwise. You can shape serious stories to make them shareable and more informative for the public. We’re not talking about watering down serious journalism — we’re talking about crafting stories for the digital audience. This happens every day in the Local Stories Project, which curates the most shareable member station content and distributes it through the NPR Facebook page. We’ve seen that people have an appetite for interacting with important stories that affect their lives. We found similar results in our research into the types of local stories that foster engagement. Still, we wanted to be sure. Can serious stories actually get as much attention as fun ones on social media? And how can reporters and editors shape serious stories so that the audience will like, share, comment, retweet, etc.? To help answer these questions, we reviewed 809 stories from the Local Stories Project that we then classified as either fun or serious. These were station stories that were posted to the NPR Facebook page and geotargeted — only people in each station’s local region could see them. The surprising results offer insight into how serious stories can be shareable. BackgroundFirst, let’s be clear about what we mean by “fun” and “serious” — as you’ll see, we’re not saying one is better than the other — a healthy mixture of all kinds of stories is good for your audience. Fun storiesThese stories probably won’t change policy or dramatically alter the way people go about their lives, but they can still be thought-provoking or offer your audience a lighthearted break in the day. These stories usually highlight something unusual, something quirky, or something funny. Serious storiesThese stories have real-life implications. They can be about something we encounter everyday, like transportation or housing costs. Or they can uncover something the public didn’t already know, like an investigation into natural gas. Serious stories help people stay aware of the news that matters to them. One-by-one, we examined all 809 stories and labeled them either fun or serious. Then, using Facebook data attached to each story, we measured success using this metric: Of the unique people who see each post, what percentage like it, share it, or comment on it? Here’s what we found: — Stations are creating as many fun stories as serious stories: Of the 809 stories, 53 percent were serious and 47 percent were fun. — Serious stories were just as shareable as fun stories: The percentage of people who liked, shared, or commented was the same for both serious and fun stories – about 1 percent of those who saw the posts interacted with them. In the Local Stories Project, we’ve found that any post over 0.7 percent leads to dozens or hundreds of likes, shares, and comments. — Top serious stories were shared just as much as top fun stories: You’d think that fun stories would garner far more engagement, but that wasn’t the case. When looking at the top 50 stories, the percentage of people who liked, shared, or commented was 3 percent — the same for both serious and fun stories. 5 questions for making serious-but-shareable storiesSo how exactly can you make serious content shareable? What you don’t want to do is wait until after the story’s already on your site. Consider your approach from the beginning. Here’s how: What’s the headline?Write a headline first — before you begin crafting your story. The headline should be a simple, straightforward, specific promise about what the story’s about. You might discover a different headline through your reporting, but starting with something precise will help focus the story. What is your approach to telling the story?What’s the best way to convey the story? Whatever you decide, get to the point right away and make the piece easy to understand. Charts, images, videos or other visuals can be helpful, but only incorporate them if it’s useful to the audience. How will this be different from what others have already done?Cut through the noise. A lot of media might be covering the story, but how can you differentiate yourself? What can you add to the story? Try creating an explainer, where you take the complex issue and make sense of it for people. Why will people share it?Imagine someone coming across your story online — what will make them take the next step to share it? Will it make them happy, sad, enraged, informed or intrigued? If it leaves your audience with no reason to interact, you’ve missed something. What’s next?Don’t ignore the story after it’s published. Compile the metrics, and ask: Did the story’s traffic and engagement fall flat? What would you do differently? Take a look at the comments and shares to learn how people felt about the story. This should inform future coverage. Want to print the 5 questions? Go here for a printable version. Serious case studiesIt wasn’t an accident that so many people liked, shared, and commented on serious stories. The station editors and reporters behind the content were thoughtful in their approach, just as they were with the fun stories. Here’s what they did to make serious stories shareable:
Image by Russ Gossett. |
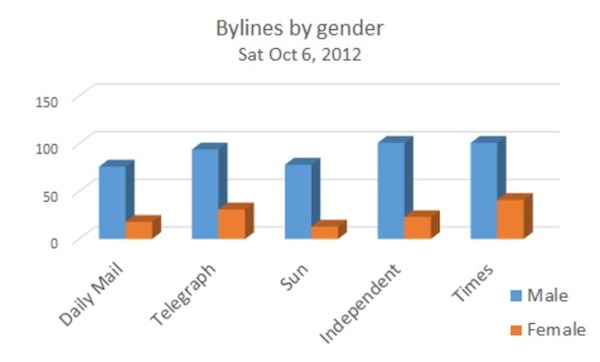
| Data from the U.K.: The gender imbalance in newspapers is real, and both vertical and horizontal Posted: 13 Nov 2013 08:11 AM PST Journalism is changing, and so is the role of women in the workplace. But the two are not always evolving in harmony. Women substantially outnumber men in journalism training and enter the profession in (slightly) greater numbers, but still only a relative few rise to senior jobs. The pay gap between male and female journalists remains stubbornly wide, and older women — especially if they have taken a career break — find it difficult to retain a place in the industry. Women in journalism still cluster around particular subject genres. Historically, they were almost totally confined to "pink ghettoes," but as more women entered the industry, there was an expectation that their opportunities would expand and that they would duly embrace areas that had been traditionally male, like hard news, crime, or politics. But a byline analysis of U.K. national newspapers in 2012 indicates that some areas still have very few women — in particular politics, sports, and opinion writing. These findings are also supported by qualitative interview data. There are similar lacunae in the U.S. press. So in addition to the problem of vertical segregation, where women are not reaching the highest ranks of journalism, there is a continuing problem of horizontal segregation: gender division by subject matter. Byline biasIn the autumn of 2012, a gender analysis of bylines in U.K. newspapers, which also coded the different sections of the papers, was conducted at City University London. The survey looked at five national papers over seven days, during two separate weeks a month apart. The total ratio of male to female bylines was not dissimilar from previous Women In Journalism surveys in 2011/12, which recorded a 78/22 split in favor of men. But what was of interest was the breakdown of topics, which showed a huge variation.
In some cases — especially but not exclusively the softer lifestyle areas — there were reasonable representations of women. But in other places, the number of bylines was scarce to non-existent. This wide difference in gender bylines by subject demonstrates what is apparent from interviewing and anecdotal evidence: Women in news organizations frequently talk about how they are encouraged to do the softer feature lifestyle stories and discouraged from the harder end of news. The number of female political reporters in Westminster has increased since the 1980s, but there are still relatively few of them. When Press Gazette published the 50 leading political reporters in 2012, it included only three women, ranked at numbers 16 (chief political reporter of the Financial Times), 36, and 39. And according to the byline survey, on some papers — the Daily Mail and The Independent — the imbalance in political reporting in late 2012 is overwhelming, with the vast majority of political stories reported by men.
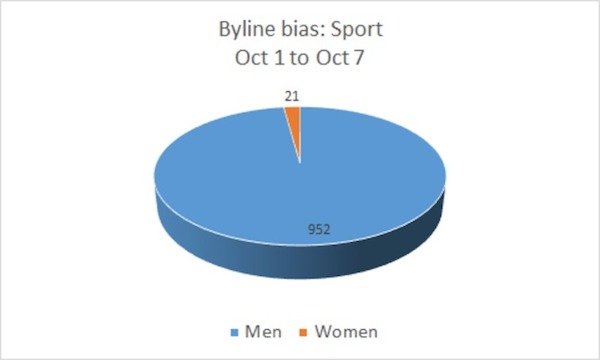
Overall, the percentage of women journalists in the parliamentary lobby is 23 percent — almost exactly the same as the proportion of female MPs in Westminster. But there is only one female political journalist listed among magazines and periodicals and none of the daily papers, broadcasters, or main political websites has a female political editor. The same holds true here: Even though there are some women, they are not finding their way to the higher strata in significant numbers. [See update below.] After politics, a second area where female bylines are pretty much invisible in the content analysis is sports journalism. Maybe this is unsurprising, because sports, even more than politics, is perceived as an overwhelmingly male activity. In 2011, a wide ranging German survey on press coverage of sport across 80 newspapers in 22 countries revealed that 8 percent of the articles were by women.
In the U.K., it appears that this figure is even lower — fewer than 5 percent of sports journalism in the national press is written by women. In 2012, only two of the Press Gazette Top 50 sports reporters were women. That said, in March 2013, Alison Kervin was appointed by the Mail on Sunday as the first female sports editor of a U.K. national newspaper. Whose opinion?A third significant area with a noticeable gender imbalance is opinion writing. Just as the obituary columns give an impression of a world far more than 50 percent male, the same is true in the comment columns. This pattern is demonstrated in the same two-week content analysis from autumn 2012, which also analysed the gender of comment piece bylines. This is confirmed in the Guardian datablog, which analysed three national papers and associated websites and found that women had written a mere 26 percent of the opinion pieces.
In the U.S., such is the dearth of female opinion writing that a pressure group and website, The Op-Ed Project, was set up to highlight the issue. The Op-Ed Project figures claim that only 20 percent of comment pieces in the U.S. media are by women and they campaign for the publication of a greater range of voices so that the proportion of comment writers who are female can grow. The Columbia Journalism Review published a lengthy analysis of this deficit entitled: "It's 2012 already: why is opinion writing still mostly male?" It compared "legacy" and new media, and found that women had a better chance of publication in digital form (33 percent compared to 20 percent in print) — but there was a sting. The online commentaries written by women on sites such as The Huffington Post were twice as likely to focus on "pink topics" — described as the "four Fs" (family, food, furniture, and fashion), plus of course the discussion of women and gender. In contrast, only 14 percent of women's opinion pieces in "legacy" media were on these topics. It attributed this to the "silo tendency" of new media, where writers are more likely to be writing for like-minded individuals. Over the past decade, areas such as conflict reporting and economic journalism have seen far more women take prominent roles. But this evidence shows that there still remain a number of subjects — softer lifestyle features on the one hand, and politics, business and sport on the other — that have overwhelmingly disproportionate numbers of one gender. Journalism might be better served if there was a more conscious effort by editors and managers to counter such horizontal segregation in the workplace. Update: This post has been updated due to an error in the original article at The Conversation. That article made a claim that there were no female political correspondents at the Daily Mail. This is not the case. Suzanne Franks is a professor of journalism at City University London. She was formerly director of research at the Centre for Journalism, University of Kent and a news and current affairs producer for the BBC, working on Newsnight, the Money Programme, and Panorama.
This article was originally published at The Conversation. Read the original article. |
| Matt Waite: How I faced my fears and learned to be good at math Posted: 13 Nov 2013 07:00 AM PST Somewhere in middle school, I had convinced myself that I was bad at math. It was okay: My mom was bad at math too. So were lots of people I looked up to. “Bad at math” was a thing — probably even genetic — and it was okay. I so thoroughly convinced myself that I was bad at math that I very nearly didn’t graduate from high school. It took tutors and hours a week to squeak through an advanced algebra class my friends had all breezed through on their way to much harder classes. But it was okay. I was bad at math. They weren’t. Simple as that. And it was all a lie. “Bad at math” is a lie you tell yourself to make failure at math hurt less. That’s all it is. Professors Miles Kimball and Noah Smith wrote in The Atlantic that many of us faced a moment in our lives where we entered a math class that some of us were prepared for and some of us weren’t. Those that got it right away were “good at math” and those who didn’t, well, weren’t. Or so we believed. Those who were good kept working to stay good, and those of us who were bad at it believed the lie. Now, Kimball and Smith write that bad at math is “the most self-destructive idea in America today.” Well, Professors Kimball and Smith, welcome to journalism, where “bad at math” isn’t just a destructive idea — it’s a badge of honor. It’s your admission to the club. It’s woven into the very fabric of identity as a journalist. And it’s a destructive lie. One I would say most journalists believe. It’s a lie that may well be a lurking variable in the death of journalism’s institutions. Name me a hot growth area in journalism and I’ll show you an area in desperate need of people who can do a bit of math. Data. Programming. Visualization. It’s telling that most of the effort now is around recruiting people from outside journalism to do these things. But it doesn’t end there. Name me a place where journalism needs help, and I’ll show you more places where math is a daily need: analytics, product development, market analysis. All “business side” jobs, right? Not anymore. Truth is, “bad at math” was never a good thing in journalism, even when things like data and analytics weren’t a part of the job. Covering a city budget? It’s shameful how many newsroom creatures can’t calculate percent change. Covering sports? It’s embarrassing how many sports writers dismiss the gigantic leaps forward in data analysis in all sports as “nerd stuff.” In short, we’ve created a culture where ignorance of a subject is not only accepted, it’s glorified. Ha ha! Journalists are bad at math! Fire is hot and water is wet too! I’m not going to tell you how to get good at math by giving you links to online materials or MOOCs or whatever. I’m not. You can Google. You should do that. No, I’m going to tell you a story. Through grit and luck and a Hail Mary pass of a grade on a final exam, I did graduate from high school. And in 1993 I went to the University of Nebraska-Lincoln, where the College of Journalism and Mass Communications at the time said the curricular equivalent of “Math? Why the hell do you need math?” I thought this was great. No math? I must be in heaven. Twenty years later, I’m now a professor in that same journalism school that let me skip out of math. We don’t do that anymore, but our math requirements are pretty thin and universally reviled by students, most of whom would say they’re bad at math. As a professor, I can take classes for free. And it’s abundantly obvious to me that journalism’s problems aren’t with journalism — they’re about money. Where does one go to learn about money? Business school. So I thought I would get an MBA to better understand the business side of journalism. I walked over to the business college and told them I wanted to do this. “Have you had calculus as an undergrad?” Oh. Uh, no. “Have to have it. It’s an admission requirement.” So almost two decades to the day that I set foot on campus, there I was, taking a math placement exam. This exam is given to all incoming freshmen to determine which math class they should start with. I took it and could barely read the questions. If they had given me a grade, I would have bombed it. I tested straight into a remedial math class for students who didn’t get enough in high school. Congrats, Math Department: Your test nailed it. I probably could have crammed and watched Khan Academy videos for hours, taken it again, and landed in a higher math class. But I would have felt like I cheated my way in. And that would have been terrifying. So, I took the class. Math 100A. Just a 37-year-old professor and 30 or so 18-year-old freshmen. Totally normal; I didn’t stick out at all. The instructor was in first grade when I was last in a math class. She asked me what I was doing there. Told her my story. Her reaction: She was bad at math too, until she got to college. Now, she’s getting a Ph.D. in it. Given all that, I lived in absolute terror that I wouldn’t do well. I sat in the front row. I asked questions non-stop. I did all the homework. I did extra practice problems. I raised my hand to answer questions so much the instructor asked me to stop. I studied for hours. And I got an A+. I was shocked. And elated. In spite of the fact that I’m a grownup and should get an A in a remedial course, I was pumped up. I can’t remember my last A in math. On to the next class. Math 101: College Algebra. Just the name gave me chills. I could barely pass high school algebra; how the hell was I going to handle college algebra? Here I was, a grown man with a family and a house and a job and a resume, sweating bullets and losing sleep about a class freshmen take. Same plan, same result: Work hard, get A+. I’m halfway through calculus this semester. I have never in my life worked this hard in a class. I’ve never sat awake at night worrying about a class like I have tossing and turning thinking about how to calculate the derivative of something. I can go speak in front of 1,000 people with less than five minutes of preparation and be downright calm compared to the feeling I have going to take a test. Right now, I’ve got a B+. And if I walk out of there with it, it’ll easily be the most proud of a grade I’ll ever have been. Why? Because at this level, I’m seeing the consequences of how a student approaches math. On each test, the median score has been around a high F or a low D. The last test saw more than half the class fail. It’s brutal. Of the 111 students in the class, I’m guessing 70 of them will be taking it again. The only advantage I have over my classmates? I know exactly how to fail at math: Don’t put any effort in. Blow it off. Do something else. A glass of wine and a rerun of Big Bang Theory kicks the crap out of applications of extrema using derivatives, even if you hate wine and loathe Big Bang Theory. But that’s the lesson I’ve learned: The difference between good at math and bad at math is hard work. It’s trying. It’s trying hard. It’s trying harder than you’ve ever tried before. That’s it. So do me a favor: Try. Stop with the jokes. Stop telling me, “Oh, I could never do that” when you ask me about math. Because it’s not true. You can. If you try. You can be good at math. Matt Waite is a professor of practice at the College of Journalism and Mass Communications. Previously, he was senior news technologist at the St. Petersburg Times, where he was the principal developer of the Pulitzer Prize-winning PolitiFact. Photo by Tony Kamenick used under a Creative Commons license. |
| Who’s giving (and getting) that nonprofit money? Some data on grantmaking to media orgs Posted: 13 Nov 2013 06:00 AM PST
As the title — “Growth in Foundation Support for Media in the United States” — suggests, the findings point to an overall increase in grantmaking in media between 2009 and 2011. In a blog post for Knight, Eric Newton said he read the study as both a call to action and a celebration, citing embrace of digital and investment in spite of the recession as reason for congratulations, while expressing concern about the static number of grantmaking institutions, only a handful of which are responsible for the bulk of the funding. Here are some of the highlights of the report, available in full here:
Because of the new taxonomy for media granting used in the report, the authors found it difficult to compare their findings with other, previous work in the same arena. For further exploration of the data they gathered, check out the Media Impact Funders website. |


 This article is based on research carried out for
  A
A | You are subscribed to email updates from Nieman Journalism Lab To stop receiving these emails, you may unsubscribe now. | Email delivery powered by Google |
| Google Inc., 20 West Kinzie, Chicago IL USA 60610 | |