Nieman Journalism Lab |

- No windows, one exit, free drinks: Building a crowdsourcing project with casino-driven design
- Homemade code: Vox Media invests in its own tech through a weekend hackathon
- From Nieman Reports: Making global local and local global
- Tracking memes across television news: A tool for analyzing how stories move through broadcast
| No windows, one exit, free drinks: Building a crowdsourcing project with casino-driven design Posted: 20 Mar 2013 12:47 PM PDT
Editor’s note: ProPublica’s been a persistent innovator on driving crowd participation in journalism projects. (We’ve been writing about it for years.) A big part of crowdsourcing is design — how best to encourage user behavior that will contribute to the project’s goals. Here, Al Shaw, in a piece written for ProPublica, describes how his team designs for engagement. (Al presented on casino-driven design at NICAR recently; here are his slides, which include a few points not in his piece.)
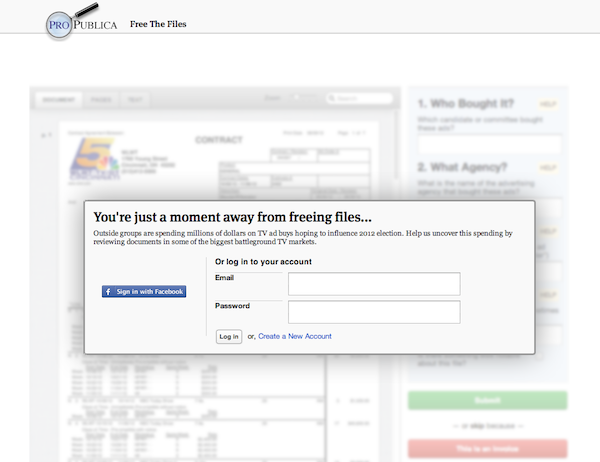
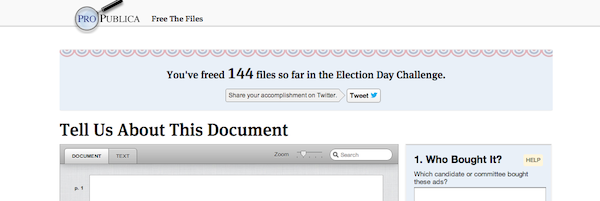
Measured by participation rate, Free the Files was an astonishing success. More than 1,000 contributors submitted over 94,000 transcriptions to help turn messy invoices from local TV networks into clean data. One volunteer transcribed over 28,000 filings. Each transcription was “verified” after two or more users agreed on all of its data points. There are currently around 17,000 verified filings, and people are still working. Much of this success came from the efforts of our expert engagement team, who motivated and interacted with our volunteers every day, and who hatched a clever campaign of social media, contests and promises of free T-shirts. Our users were, of course, also motivated by their own sense of civic responsibility, wanting to help build the first free database of political TV ad spending. But design played a significant role as well. We kept our eye on optimizing each page for participation. We called the design we devised for participation-oriented areas of the site “casino-driven design.” A variant of behavior design, casino-driven design cuts away all distraction and drives the user’s attention toward staying focused on a single task. No windows. One exit. Free drinks.Why do we call it casino-driven design? Casinos are notorious for adopting an interior design that keeps people gambling. There are no windows and no clocks, so it’s easy to lose track of how long one has been gambling. Casino-driven design creates an optimal atmosphere for task completion by actively discouraging cross-site exploration and page exits. And, like in a real casino, we keep the small rewards flowing, such as seeing your name on “freed file” pages and on a leaderboard. There are no site-wide template elements on casino-driven pages — no section links, ads or even a link to the homepage. Casino-driven pages start out as a blank white page. We add only the elements necessary for users to understand where they are and the nature of the next task. The only way off the page is to complete the task or abandon it. But there’s more to casino-driven design than just a clean page. Glass doorsThere are two important goals in getting people to complete crowdsourcing tasks: getting them to start volunteering and getting them to keep going. We tried out a bunch of strategies for getting people into the app for the first time, but our favorite was the “glass door”: We show a tantalizing taste of the activities that will become available after a user takes the first step — signing up:
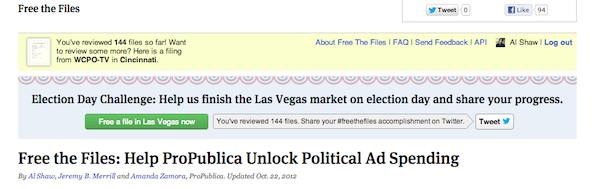
Behind the “frosted glass” is a view of what you’ll be able to do once you’ve logged in. It’s hard to get to that screen and not want to see what’s behind it. We also helped our readers find an activity using yellow and blue wayfinding at the top of each page:
Yellow status bars across all of our apps mean “this stuff is about you.” In Free the Files, we used it to give people quick links to logging in, an at-a-glance look at how many files they’ve freed, and what’s coming up. Light blue boxes and bars across our apps mean “here’s the most important thing you can do” (we call this shade of blue “do-something blue”). When we launched an election-day contest to transcribe all the files in Las Vegas, we put a blue bar on top of the pages to let them know there was an important activity to take part in. By the end of the single-day Las Vegas challenge, we had transcribed every file in the market. Low frictionOnce inside, we keep the click targets really big and bright, and the number of actions as low as we can get away with. We spent a long time editing down the number of data elements we asked our readers to help us transcribe. In the end we pared down to four elements — and after launch we found ways to cut that down even lower. Once the user has transcribed a document, he or she can mash the big green or red button. Quite satisfying!
To keep people around longer, we engineered the page never to fully reload. There was never a reason for people to leave the page — we provided pop-up instructions and autocomplete boxes for values we thought users may type in. For example, we preloaded the “Who bought it” autocomplete field with committee names from both the FEC’s database and the FCC’s file naming scheme, so users could start typing and choose one rather than try to decode the often confusing forms. Finally, we borrowed a trick from the gaming world by adding a leaderboard so that users could (justifiably) brag about how much they were contributing. They became super-competitive about their spot on the board. During the election-day challenge, we showed users their single-day count right in the yellow bar on each page to help them keep track of their score. Users were also able to brag in social media about freeing files — in a popup, without leaving the casino.
Casino-driven design was resoundingly successful in our election-related apps. We later used it to help drive participation in our Message Machine project. We’re excited to keep evolving it when we build crowdsourcing apps. Looking aheadCasino-driven design is all about reducing friction to participation. We showed Free the Files to some MIT computer science profs and they gave us some interesting ideas we’re eager to try in future casinos. One of the things that made transcribing the ad contracts difficult was that there were a plethora of proprietary page layouts that each station or network of stations used. This meant that users had to hunt around for the same data points in different places on different filings. It’s possible to cluster similar-looking documents using a technology called computer vision and then only show one kind of page to each user. That ought to speed their work up. We also plan to experiment with presenting users with a single task — say, transcribing just the date on a single form design — and repeating the task over and over again. This may let the unconscious mind take over and speed task completion enormously. Different users would see different elements to transcribe, so we’d still end up with the same data, just split up more atomically. Beyond that, we could also ask users simply to draw boxes around the spot where each data point can be found in these various formats and then write software to look in those places and use OCR to transcribe what it finds. OCR isn’t a good fit for analyzing entire documents like in Free the Files (especially scanned or faxed pages), but if we have human help to guide the OCR on these boxes, we may eventually be able to grab data out of forms with only human verification. Poker hand photo by Alessandro Cani used under a Creative Commons license. |
| Homemade code: Vox Media invests in its own tech through a weekend hackathon Posted: 20 Mar 2013 09:00 AM PDT
They descended on Austin in droves, excited by the promise of BBQ and fresh discoveries in technology. And then they locked themselves inside a room for three days straight. This is not a South by Southwest story. For several days at the end of February, the developers and designers who work behind the scenes at Vox Media dove head first into code, quickly conceiving and building new products that could be put to use in places like SB Nation, The Verge, or Polygon. It was a self-made hackathon: The product team banded together and suggested a long weekend devoted to nothing but building. What resulted was more than a dozen projects, ranging from back-end technology like JavaScript testing tools and a system to automate advertising mockups, to features that will help in reporting and community engagement, to apps that could expand the company’s reach with new products on tablets and smartphones. One project, Featherbottom (great name, by the way), would speed up the process of optimizing, cropping, and watermarking photos sent from photographers into liveblogs. Another, Providence, is a universal traffic tool for real-time analysis. Developers created a design framework that would allow Vox to produce tablet magazines for iPad, as well as a web app for Polygon that would bring the features of a native app into the mobile browser. So does this mean we should expect new web apps and tablet magazines for The Verge, Polygon, and SB Nation in the very near future? Not quite, said Vox Media CEO Jim Bankoff. Bankoff told me there’s nothing new to announce on the tablet or smartphone front: “We’re always exploring new ways of presenting content to our audience.” What will we see sooner? Trei Brundrett, vice president of product and technology for Vox Media, said they plan to launch several of the smaller projects first. On that list: a new notification system that will alert readers when someone responds to a comment on any Vox site they’re having a discussion on. They’re also releasing a deep-linking tool, in the spirit of The New York Times’ Emphasis and Quora’s Embedded Quotes, that lets readers select and share specific paragraphs within a story. Others are more behind-the-scenes products that can help Vox keep the trains running on time, like Beacon, a project management system meant to keep people up to date on what other teams are working for, Brundrett said. Building things from scratch has worked pretty well for Vox so far. They created Chorus, the company’s CMS that handles all three sites, as well as Syllabus, the lightweight systems that powers liveblogging. The benefit of homemade tech isn’t just having systems for your particular need, but that it gives developers stronger ties to the company, Brundrett said. “We’ve tried to create a culture where they are empowered to influence what we create,” he said. “The result of it is they feel ownership over it.” Brundrett told me members of the product team came up with the idea independently, pooling the personal time Vox employees can set aside for training to use for the hackathon. The fact Vox cut a good chunk of its production staff loose to hack on internal projects — which may or may not benefit the bottom line — is a measure of the growing role of technology development in running a modern media company. Technology is the backbone of good journalism, which helps develop audience and serve advertising that pays the bills, said Bankoff. “I have a very deeply held belief that technology has to propel a media company,” he said. Bankoff came from the technology world, having previously worked on projects like Mapquest and AOL Instant Messanger while working at AOL. Bankoff said media companies have to approach technology just like any other product they develop — invest in people who are inventive and creative. Bankoff said he’s proud of the fact that the event was self-directed from start to finish. Given that developers had freedom to make whatever they want, he’s also pretty happy they focused their attention on the needs of the company. Image by Trei Brundrett used under a Creative Commons license. |
| From Nieman Reports: Making global local and local global Posted: 20 Mar 2013 07:45 AM PDT Editor’s note: Our colleagues at our sister publication Nieman Reports are out with their new issue, and there’s a lot of great stuff in there for any journalist to check out. Over the next few days, we’ll share excerpts from a few of the stories that we think would be of most interest to Nieman Lab readers. Be sure to check out the entire issue. Here, Maria Balinska, founder of Latitude News and former Nieman Fellow, writes about her aim to make the local global and the global local.
Here’s the back story. I’ve spent my entire career — 18 years of it at the BBC — in international journalism, reporting and editing stories “abroad” for audiences “back home.” But what’s become increasingly clear is that this kind of distinction is artificial. We may all be aware of the fact that we live in a globalized world but it’s not very often that you see journalism that explicitly connects the dots between what’s happening in one country and another. Why is a Brazilian company employing former NASA engineers to build corporate jets in Florida? How did the governor of Nebraska get over 50,000 followers on Weibo, China’s equivalent of Twitter? And what are people in other countries doing about bullying, an urgent problem on the agenda of schools across the U.S.? To put it colloquially, it’s time to “mashup” (the wonderfully graphic term I’ve borrowed from music and web development) the local and the global. As we’ve found at my journalism startup Latitude News, there’s a gold mine of stories crying out to be told, stories that our readers and listeners say are “fresh”, “powerful” and — here’s the kicker — “relatable to.” Once you relate to something, chances are you are going to be interested and engaged. Keep reading at Nieman Reports » |
| Tracking memes across television news: A tool for analyzing how stories move through broadcast Posted: 20 Mar 2013 07:13 AM PDT Too long, didn’t read: You can use this Ruby script to query Archive.org’s recently-launched TVNews archive and download JSON files with the results. It’s great for tracking how frequently a person or topic shows up in U.S. televised news broadcasts. One of the goals of our research at the MIT Center for Civic Media is to better quantify media attention. We want to know which stories, people, and events our society is paying attention to, which we are missing, and the role our media plays in determining what we see. We’re working with the fine people at Harvard’s Berkman Center to build out Media Cloud. In addition to building tools, we also investigate case studies of news stories that offer greater insight into how the news plays out. You may have seen Yochai Benkler’s investigation into SOPA and PIPA and a networked movement’s success driving the media narrative: Last year, I wrote about the Trayvon Martin story’s ascent from local blurb to national media trend. This initial analysis relied on a mixture of sources: interviews with key actors, petition data from Change.org, audience reach metrics from various news sources, Google Trends, visualizations of physical front pages of newspapers, and the Pew Project for Excellence in Journalism’s News Coverage Index. After the post attracted some interest, we investigated further with additional datasets. With the help of my colleague Erhardt Graeff, we added Media Cloud to the mix. Media Cloud allows us to see who’s talking about the story on blogs and webpages, which voices are dominating the discussion, and which words and frames they’re introducing to the narrative. (More on our findings to follow). I also added Twitter firehose data to the mix, thanks to General Sentiment. Even though we’re excited about the potential of participatory media to help shape what we pay attention to, our media research consistently finds that broadcast media — primarily TV — still plays a critical role in the amplification of voices. This was especially true for the Trayvon Martin story, which moved relatively quickly from obscurity to wall-to-wall cable news coverage. At the same time, the team at Archive.org, that quintessential Internet resource, was busy launching their TV News archive. The search tool queries more than 410,000 broadcasts, dating from June 2009 up to 24 hours ago. (They are working to extend the archive further back into history.) The search results deliver video clips ready to play the section of video containing your query. It’s a fun interface for exploration, but if you’re looking at how a story trends over several months, you need something more systematic, and may want to use our script. The Archive.org team is working to build out the platform and improve the user experience. They don’t currently have capacity to guide and support researchers at the moment, but they do want to get this data in the hands of the curious as soon as possible. To that end, they’ve given me permission to share this quick Ruby script I wrote with the help of my colleague Rahul Bhargava. How to use the script
Your results will show up in the same directory as the script itself. The results returned will be in JSON, the open data format. You can adjust how many results to return at once (by changing the Once you have your data, you can combine, clean, and parse it with Google Refine. I found ProPublica’s guide to cleaning messy data really helpful. You may also want to de-duplicate, because Archive.org records TV news broadcasts on the both the east and west coasts. What you can do with itAnalyze a story: You could search for a specific story, like the recent controversial Steubenville rape case, and quickly get a sense of which news companies are covering the case and which words they use to talk about it. You can also share links to specific clips with your friends and colleagues. You could also investigate our professional media’s treatment of a broader topic. You could trace the spread of the phrase “Obamacare” or watch the many breathless news segments covering “technology.”
For example, in the Trayvon Martin case study, we ended up normalizing the data with the number of Trayvon mentions in the printed press, blogosphere, on Twitter, and across other channels to determine when interest began and peaked. As you can see with the green bars below, TV news was an important channel in the early stages of the Trayvon Martin story.
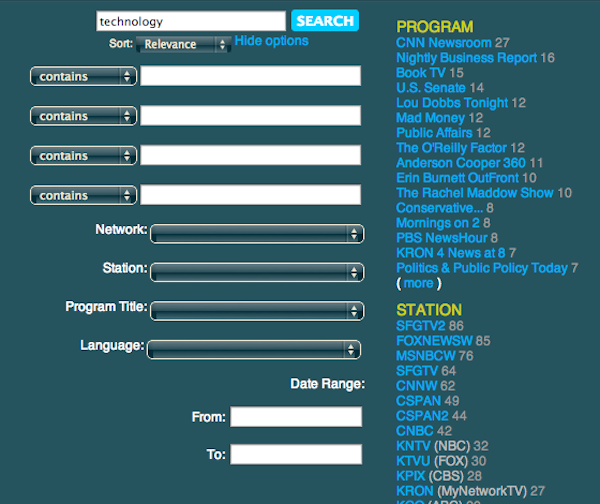
This data source helped us determine that TV news led the press and other media in making (and keeping) Trayvon Martin national news. Do an advanced search: The advanced search settings allow you to restrict your search by program, station, date, topic, and clip length. If you customize your search in the web interface, you’ll see which parameters get added to the search results URL. You can then copy and paste those into your Ruby script to add the same filters to your bulk data download.
Compare station-by-station coverage: You could also look at how a story or topic between the East and West coasts of the United States. Archive.org’s news database contains recordings from Washington, D.C., San Francisco, and national programs. Here’s a list of the station call letters and their locations. Borrow DVDs of programs: If you want more than the short clip containing your search query, you can borrow a DVD recording of the full broadcast from the Internet Archive. To do so, you can either show up in person at Archive.org’s San Francisco library or pay a (sometimes refundable) $25-75 fee to have it mailed to you. Matt Stempeck is a graduating master’s student at the MIT Media Lab’s Center for Civic Media. |


 My journalism manifesto comes down to three words: local global mashup.
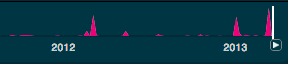 Visualize TV news data: You’ll also have the data you need to visualize the lifespan of a story on televised news broadcasts. Archive.org renders a small line graph in your search results, but the JSON data will allow you to do much more.
| You are subscribed to email updates from Nieman Journalism Lab To stop receiving these emails, you may unsubscribe now. | Email delivery powered by Google |
| Google Inc., 20 West Kinzie, Chicago IL USA 60610 | |