Nieman Journalism Lab |

- Lessons from The New York Times’ app graveyard: When an app has an expiration date
- Feelings, nothing more than feelings: The measured rise of sentiment analysis in journalism
- Press Publish 3: Jay Rosen on the public, how the press thinks, and the production of innocence
| Lessons from The New York Times’ app graveyard: When an app has an expiration date Posted: 23 Jan 2013 12:10 PM PST
The Times launched the app some 13 months ago, on the eve of primary season, and the plan was always to give it an expiration date, Times emerging platforms editor Fiona Spruill told me. “We felt like that made the most sense in terms of how we were thinking about it as a product,” Spruill said. “I wouldn’t look at the fact that this app is going away as any kind of sign that we’re not going to do anything like this in the future.” (Spruill jokes that by 2016, “we’re all going to be wearing all of our political coverage” anyway.) Election night itself brought one significant tipping point for the Times: The first moment in its history when its digital audience skewed mostly mobile. “I don’t know if we were necessarily surprised, but we were happy to learn that election night, during some of the prime time hours, of all visits to New York Times digital properties, more than 50 percent of visits were coming from mobile devices,” Spruill said. “Mobile cracked that 50 percent threshold during election night.” But it’s still noteworthy that the Times is opting to shut down the app rather than, say, morph it into a general standalone politics app — or just rebrand it as Elections 2014 or 2016. After all, it’s already sitting on the home screens of a lot of phones. (Launching it today gives the message “Our Election 2012 Coverage Has Concluded” and pushes people to use either the Times’ main app or NYTimes.com.) The Washington Post’s WP Politics app, which it created for the iPad during primary season, is still available in the iTunes store. The team behind that app is “transitioning our editorial production and steadily working to build out our flagship iPad product to offer just as much richness as the Politics app,” the Post’s executive producer for digital news, Cory Haik, tells me. (Disclosure: I freelance for The Washington Post.) Back at the Times, where Spruill calls her area of the newsroom a “great, wonderful kind of sandbox for us to test out a bunch of things,” being able to ditch an app tied to a past event is in some ways liberating. “Readers can continue to get all of our political coverage in our main news app and on the website,” said Jonathan Ellis, assistant editor for digital platforms. “By retiring this app, it frees up resources to think about our next big challenge rather than maintaining.” But there are plenty of lessons from this 13-month experiment, which Spruill says “surpassed expectations.” (She declined to say how many downloads the app got or to share metrics on engagement.) Here are three of them: 1. Humans make apps better; and so do other news organizationsAs we wrote at launch, the Elections 2012 app was one of the Times’ most vigorous forays into aggregation — including prominent links to other news orgs’ stories on the same subjects the Times was writing about. Ellis: “This was the first time that we’ve had a human editor dedicated to an app, and that’s Sarah Wheaton. So it may not have always been completely apparent to every user, but there was an editor working on this app, collecting the best from the Times and around the web. This was also a big experiment for us in bringing in content from other news organizations into one comprehensive political report. We really made a lot of strides, just from an editorial perspective.” 2. HTML5 makes everything betterThe New York Times 2012 Election app was built primarily with HTML5; it’s since debuted an all-HTML5 web app to complement its native mobile apps. Ellis: “The app wasn’t entirely HTML5 — you obviously downloaded it through the Apple App Store or through the Android Market — but the majority of the app was HTML5, which was another big experiment and learning experience for us…This app is not one of our primary news apps, so we can’t put all of the resources into it, but by using HTML5 it really allowed us to be versatile because we could make changes sort of on the fly. HTML5 lets you do that more easily.” Spruill: “It’s very important to note that our interactive news team and our graphics desk played a huge role in the success of the app — all the great work they do in terms of maps and graphics and deep databases of information…Everything we did on election night in terms of live results, they were all able to do that because the bulk of the app was HTML, so they could think about it holistically.” 3. Interrogate the logic of launching an event-specific appThe Times decided that a dedicated elections app was worth the time and resources — but that can be a tough calculation to make. Ellis: “We talked about it for the Olympics, but decided against it because it was such a relatively short period of time. Building that audience is difficult. It takes a while. It’s not something you can just do overnight, and that is something that is different about the app ecosphere.” For now, the Times is applying its experience with the elections app to its main news app. That includes testing new kinds of storytelling that debuted first in the app, like clustering tweets and articles around a given topic. And Spruill’s team wants to focus squarely on 2013 before dreaming up a mobile strategy for the midterm elections or beyond. “It’s obvious that mobile was a huge part of this election,” Spruill said. “The next election, many news organizations probably will have crossed that 50 percent threshold where they’re getting more traffic from phones and tablets. So I imagine it would be quite a bit different how many news organizations focus on their election coverage. It’s hard to say exactly what format that will take.” |
| Feelings, nothing more than feelings: The measured rise of sentiment analysis in journalism Posted: 23 Jan 2013 07:00 AM PST
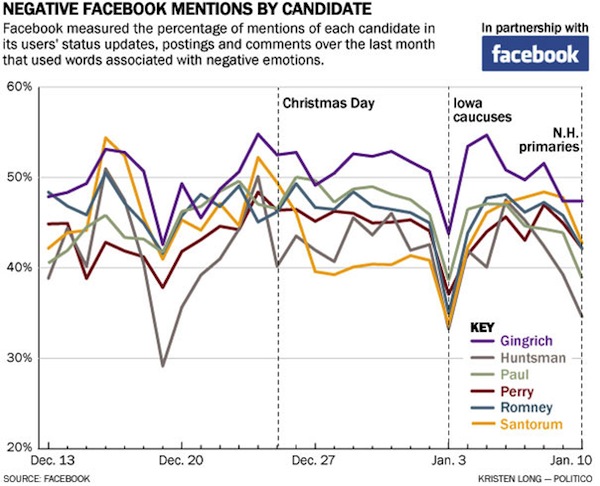
“Punditry is fundamentally useless,” Nate Silver said repeatedly, in one form or another, after the election. When fuzzy interpretation was put up against statistical analysis, the stats won out. But not every journalistic question benefits from the data set that Silver and the other electoral quants had to work with. What if you want to measure a question that doesn’t offer the cleanly defined Obama-or-Romney options of an election? Or what if you’re interested in the opinions of a group that isn’t defined by the electoral boundaries — or one where there just isn’t good polling available to aggregate? These are the sorts of questions where journalism turns to pundit representatives. Want to know what “hockey moms” think? Sarah Palin gets called upon to represent them. How about the Occupy movement? Call Michael Moore. The Tea Party? Bring in Dick Armey. Gun owners? Alert Alex Jones. This sort of representative punditry comes with obvious, distorting flaws: Alex Jones doesn’t represent all gun owners and Michael Moore doesn’t represent everyone on the activist left, but the workflows of contemporary journalism let both stand in for what a larger group is thinking or feeling. And if your group doesn’t have an obvious mouthpiece, someone already in a cable news producer’s contacts? You might just get excluded from the narrative altogether. That’s one reason news organizations are increasingly turning to sentiment analysis to try to reflect a crowd’s thoughts through data instead of punditry. When used wisely, sentiment analysis can push back against sweeping punditry claims and let many voices contribute to a message. Sentiment analysis aims to analyze what a percentage of the population “feels” about something, often by measuring the sentiments embedded in social media posts or by asking a community directly to share its feelings, thoughts, or opinions in a machine-readable way. Many news outlets have already deployed sentiment analysis, to various effects. Politico, Pew, NBC, CNN, Current TV, Twitter, Facebook, and many others have all tried to measure the thoughts and feelings of social media groups or run these analyses a regular basis. For example, after the GOP primary, an analysis by Politico showed the amount of negativity expressed towards each the candidates on Facebook during the most intense months of the primary season. Newt Gingrich led handsomely.
The use of machines — or machine learning — in this way to discern the meaning of human feeling about a topic is by no means unique to social media. The New York Times wrote about “affective programming,” and how computers may soon read your facial expressions and respond to you. Another Times piece famously explained how Target can now determine when you are pregnant based on your consumer habits — sometimes, before you realize yourself. What’s interesting about the use of sentiment analysis by journalists, though, is that so many of the industry’s ongoing concerns seem to crystallize in its promise: how to deal with social media platforms where the power to publish now belongs to millions; how to find a way to speak more authoritatively about the world it reports on; and how to take complex questions and display them simply and visually. And it’s true that sentiment analysis does offer real potential on these question. Already, the technology exists to fire up software to go into a group Facebook page, run through specific posts, and gather a list of most discussed themes and general positive or negative reaction to specific debate points. This could be turned onto, say, The Tea Party Patriots page, with nearly 1 million users, to enrich knowledge of “the Tea Party opinion” on an issue. And at times, sentiment analysis has proven to be smarter than other data sources, as when it predicted Harry Reid’s 2010 reelection campaign was looking stronger than polls suggested. Bu how accurate is this stuff? As Micah Sifry, co-founder of the Personal Democracy Project, said to me: “Whenever you hear the words ‘sentiment analysis,’ your BS detector should go up.” Sifry wrote a bearish take on Politico’s use of the technology, calling for them to stop using it and explaining some of the internal problems with machine learning. Without going too deep into the weeds, natural language processing’s problems can be imagined by thinking about the “sentiment” of the following statements: — “It is a great movie if you have the taste and sensibilities of a five-year-old boy.” These examples — provided by Christopher Potts, a linguistics professor at Stanford who teaches natural language processing for the school’s computer science department — show the complexity. “Tumult” might sound like a negative sentiment, but if it’s in the context of a democratic revolution the speaker supports, maybe it’s not. In the first quote, it’s hard to know the speaker’s goals: Is this someone speaking tongue-in-cheek as a mom to other moms? As Potts says: “If you and I are best friends, then my graceful swearing at you is different than if it’s at my boss.” There is a certain threshold of knowing what other people mean when they speak that is still hard for machines to reach without additional information.
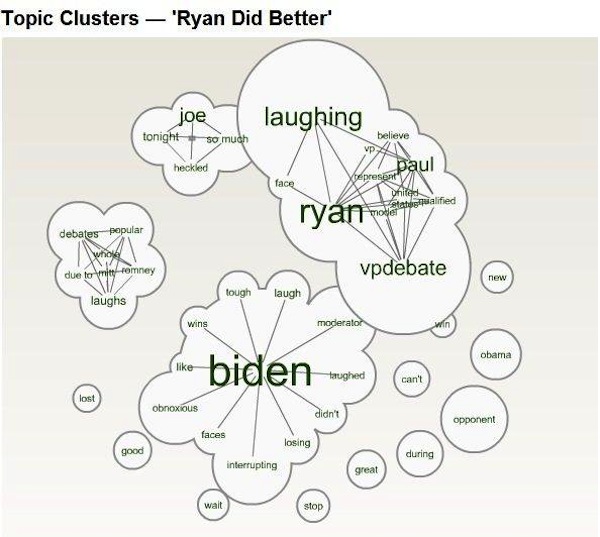
One popular tool, Crimson Hexagon — which has been used by CNN, NBC, Pew, and Current TV — claims its technology produces 97 percent accuracy. But what does “accuracy” mean in this context? It doesn’t mean Crimson Hexagon goes one-by-one to the authors of the analyzed posts and asks them what they really meant and that they’re right 97 times out of 100. Instead, it measures the tool’s accuracy relative to a hypothetical group of humans — a hypothetical test group who read the same tweets or Facebook posts and gauged what their authors were thinking. Crimson Hexagon tests its product against human groups in this way. So its accuracy is basically a rate at which it keeps up with “the crowd.” So how accurate is the crowd? On this, too, researchers disagree, because there is no single interpretation of language. Anywhere from 65 percent to 85 percent is a reasonable guess, depending on the difficulty of the analysis. In the video above, Shawn Rutledge, chief scientist at Visible Technologies, discusses one sentiment-analysis study his company performed for a financial institution. The good news: The machine-driven analysis was found to be very close to an analysis by humans, with no statistically significant difference between the two. The bad news: “The problem is that the reviewers thought that the humans sucked at annotating sentiment just about as much as the algorithms.” (Philip Resnik, who teaches linguistics and computer science at the University of Maryland, says one possible way to label the results’ accuracy would be as a “percentage of human performance” — consistent with the idea that all analyses are judged against a test-control group, not objective reality.) Setting a machine algorithm on hundreds of thousands of tweets about Mitt Romney’s statement about “binders full of women” and asking it to parse the thick cloud of sarcasm and irony, for example, is a tough nut to crack. Software can hit snags when trying to grasp complex language, or it can encounter bots or nonsense that isn’t filtered out. When used carelessly, sentiment analysis’ results can be absurd. And that’s all before considering the difficulty of using any social media universe to represent a broader group of people. During the election, many polls were criticized for methodologies that undercount voters who had only mobile phones, noting that they likely undercounted young and less-wealthy voters. A social-media-centric view of any population likely brings its own distortions — for example, possibly undercounting the elderly or other groups who might be less likely to livetweet a presidential debate. For news organizations, then, the question is whether this imperfect accuracy should keep the tool from being used. I don’t think so: All sampling technologies have problems, including the very best polls news organizations produce or write about. What’s essential is how results are presented — with the appropriate context and caveats about its limits. Someone who has made headway at that is Alex Johnson at NBC News, who for the last year performed a number of Crimson Hexagon-driven sentiment analyses. Johnson wanted to find a way to try to say something about people’s online conversations and had some background analyzing data, so he spent time reading through a grip of white papers, statistical models, and documentation. He finds the technology “still pretty rough,” but thinks it adds value to NBC. Johnson’s first problem was how to display results while being transparent about its inherent problems and setting it apart from normal polling. “The number one rule we have is we want to make it crystal clear that this is not a poll,” he says. He experimented with a number of disclaimers through the election cycle. At some points, he linked to and tweeted a blog post he in which he describes his methodology. He tries to explain upfront that this is a new technology that only captures a segment of the population and he stays away from saying it is accurate to a specific percentage level. His guiding philosophy, which he picked up as a newspaper reporter, is that your piece should support your lede, which he considers in this case the analysis results. “Let people see how you did it and give people a basis to challenge you,” he says. Some of Johnson’s most revealing findings are in trends in the conversations, which create linguistic maps around concepts or ideas.
Johnson’s brief analysis from this graphic: “A representation of key words in comments that said Ryan did better illustrates the degree to which his performance was defined in relation to Biden’s. Notice that the word ‘Biden’ is fully as prominent as the word ‘Ryan.’” Reporters could present this result as in keeping with an influential body of political science research that finds conservatives tend to define themselves “against” liberals. Johnson also recommends running analyses over a long time-window — like trawl-fishing over a massive ocean. Long after an event, he finds fluctuations in feeling at pressure points, such as the Sunday talk shows, specific media ad buys, and other follow-up events. Johnson also emphasizes that this technology only reads a specific userbase — those on social media. But even within that limited universe, a group-based analysis can be a powerful way to challenge those people representing — or claiming to represent — those groups. The key is to not let imperfect sentiment analysis take charge of an overall coverage strategy: It’s a conversation starter, not a conversation ender. As Simon Rogers, editor of the Guardian Data Blog — which worked across the Guardian newsroom to do a highly successful sentiment analysis of tweets during the London riots — says: “It’s when you combine traditional journalistic know-how with a manual check that makes something much more rigorous and trustable.” Whether using existing sentiment analysis software — Crimson Hexagon, Topsy, Radian6 —or building your own tools with open-source software such as R and code from GitHub, the potential for new forms of human feedback exists. Nate Silver puts this idea succinctly in his book: “Data-driven predictions can succeed — and they can fail. It is when we deny our role in the process that the odds of failure rise.” Much reporting about activity on social media end up being purely quantitative — think of the regular reports on how many tweets per second were generated at each of the election’s high points. As Lydia DePillis put it in TNR: “Really cutting-edge Twitter analysis means that interested parties can talk back.” When media outlets engage Twitter conversations, they encourage this participation to flourish, and even quirky tools can provide a placeholder for kicking things off. The media already does plenty of “sentiment analysis” — every time a commentator divines what voters do or do not really “care about,” or what Americans are or not “really thinking” about at any moment, as if this can be easily discerned with a quick read from the tea leaves. As Nate Silver showed, the gut, often self-interested, is far from foolproof. Even though it still has a lot of room for improvement, machine-learning sentiment analysis can, when used properly, bring more people into the conversation. |
| Press Publish 3: Jay Rosen on the public, how the press thinks, and the production of innocence Posted: 23 Jan 2013 06:00 AM PST
Given that journalism is a profession centered around the idea of an audience, it’s a little bit disappointing how few journalism academics ever feel much need to engage with the general public. And the names that might come to mind as exceptions to that — Marshall McLuhan, Neil Postman — were more fundamentally interested in media than in journalism proper. That’s why Jay has been so valuable to the field and, I’d argue, the profession — he’s an inside-outside voice pricking journalism when it needs to be pricked. His ideas, once shouted down in newsrooms, have become something closer to received wisdom for many. He’s changed the way people think about political reporting in particular, and he’s built an audience of his own for his thinking, both in and out of journalism.
ListenOr listen in your browser: [See post to listen to audio] Show notes
This posting includes an audio/video/photo media file: Download Now |
 The election is over. Even the inauguration
 My conversation with Jay touched on a lot of subjects: his entry into first journalism and then the journalism academy; the influence of James Carey, Postman, and McLuhan on his work; the Lippmann-Dewey debate and the changing conception of “the public” in journalism; the rise and quasi-fall of civic journalism; why we need a better horse-race journalism; how the press’ conception of itself evolves; how he’s trying to model a different kind of journalism education; whether I’m too much of a pessimist; and what he’d like to be remembered for. It’s an idea-packed hour; I think you’ll like it.
| You are subscribed to email updates from Nieman Journalism Lab To stop receiving these emails, you may unsubscribe now. | Email delivery powered by Google |
| Google Inc., 20 West Kinzie, Chicago IL USA 60610 | |